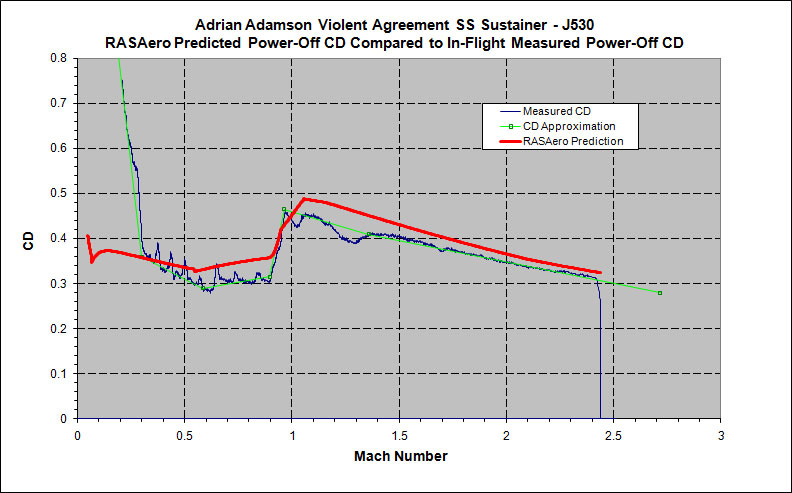
Presented below is a comparison of the RASAero II predicted power-off drag coefficient (CD) and in-flight measured power-off CD for the Adrian Adamson Violent Agreement SS Sustainer rocket flown on a J530 rocket motor. The rocket was flown with a Featherweight Altimeters Raven altimeter. The rocket CD was measured during the coast phase of the flight based on the on-board measured axial acceleration and the burnout mass of the rocket.

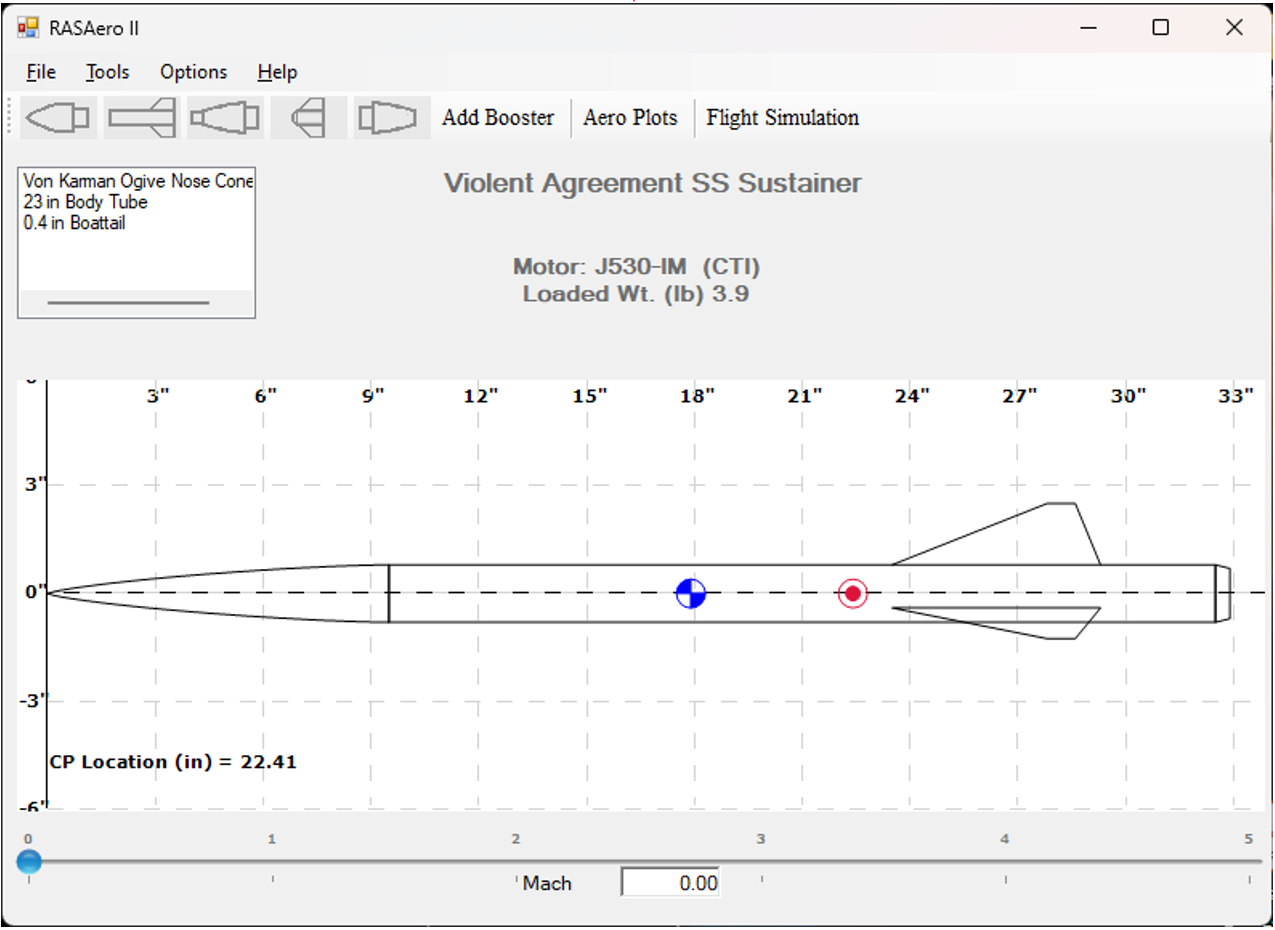
On the Violent Agreement SS Sustainer rocket the fins are mounted farther up on the body tube than normal, because the rocket was designed to be the upper stage on a multi-stage rocket, with the body tube extension sliding into the expansion section at the front of the next stage.


The RASAero II predicted power-off CD shows good agreement with the in-flight measured power-off CD for mid to high subsonic Mach numbers, transonic Mach numbers, and supersonic Mach numbers up to Mach 2.4.
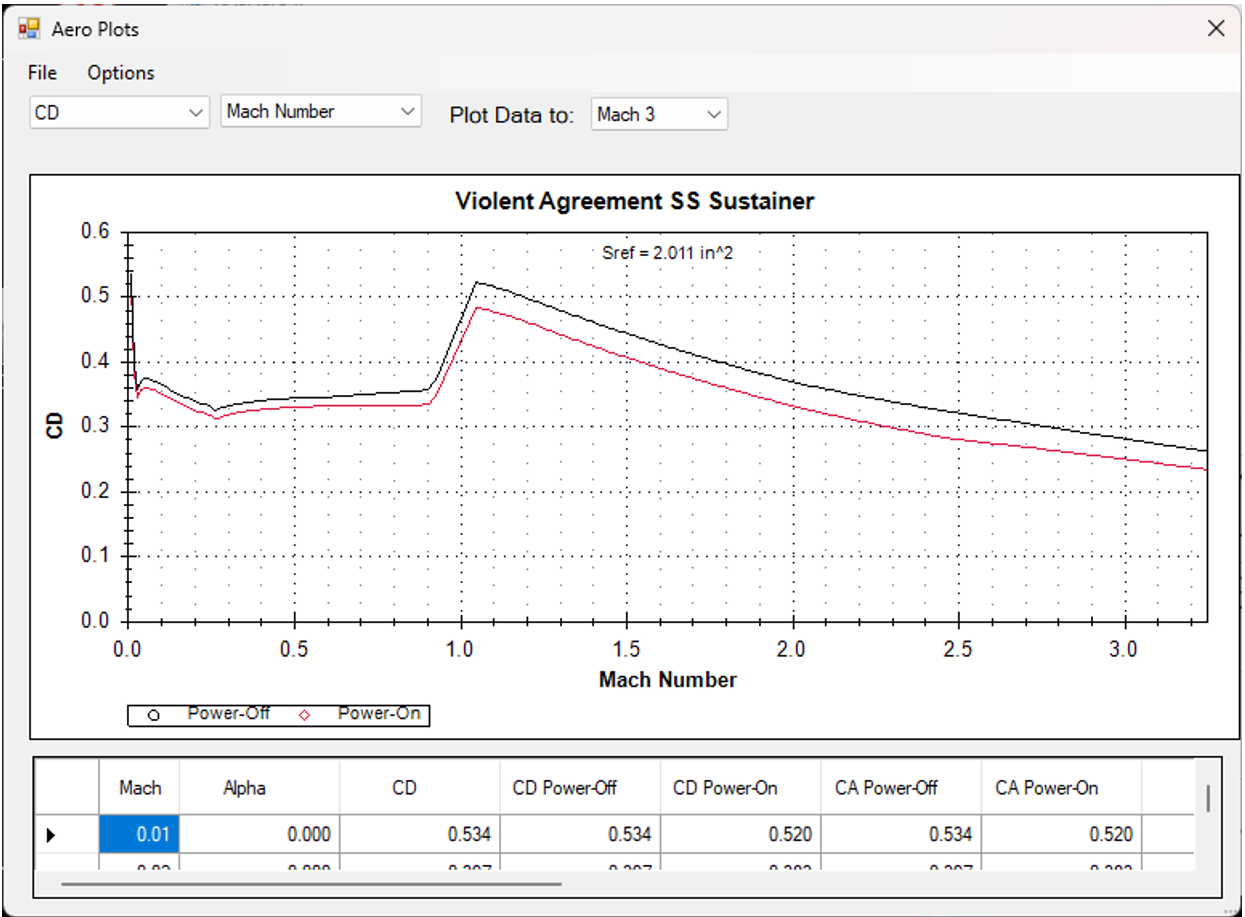
The RASAero II aerodynamic prediction for the Violent Agreement SS Sustainer rocket was run with the main input screen All Turbulent Flow Box Not Checked, i.e., the normal default laminar flow - transition to turbulent flow - turbulent flow option for the skin friction calculations.
The RASAero II flight simulation predicted altitude was 24,784 ft, an error of 8.35% compared to the 22,874 ft apogee altitude from the onboard barometric altimeter, which was adjusted for balloon-referenced atmospheric pressure data from a balloon launched prior to the flight to arrive at the final in-flight measured apogee altitude. The rocket had some angle of attack/sideslip oscillations at the beginning of the flight, which may explain the overprediction in the altitude despite the good agreement with the in-flight measured CD during the coast phase.
Special thanks to Adrian Adamson from Featherweight Electronics for providing the flight data and the rocket data for this rocket.